How Combining System Logs and Human Feedback Creates a Smarter Product Roadmap

Bridging the Gap Between Device Data and User Experience
read more

Back to all posts >

Why do insights that resonate within specific customer segments sometimes fail when applied to your overall customer base? You could be seeing the effects of Simpson’s Paradox — a statistical phenomenon that can cause CX teams to draw the wrong conclusions and make misaligned decisions.
What Is Simpson’s Paradox?
First described by Edward Simpson in 1951, Simpson’s Paradox occurs when a trend appears in several groups of data but disappears or reverses when those groups are combined. In simpler terms: what’s true for the parts isn’t true for the whole.
Picture a scenario where a new service feature improves satisfaction among both premium and standard customers when viewed separately, yet overall satisfaction declines when the data is combined. That’s not a reporting error, it’s Simpson’s Paradox, a surprisingly common challenge encountered in customer experience analysis. This surprising reversal is often caused by the influence of a confounding or lurking variable; an unaccounted-for factor that affects the relationship between the variables being analyzed.
Simpson’s Paradox serves as a powerful reminder that data context matters and that aggregated results can sometimes tell a very different story than the individual components behind them.
Why This Matters for Customer Experience
Customer experience professionals live and die by their metrics. But if those metrics are susceptible to Simpson’s Paradox, you could be making decisions that harm rather than help your customer relationships.
Consider this real example from a retail company’s NPS scores:
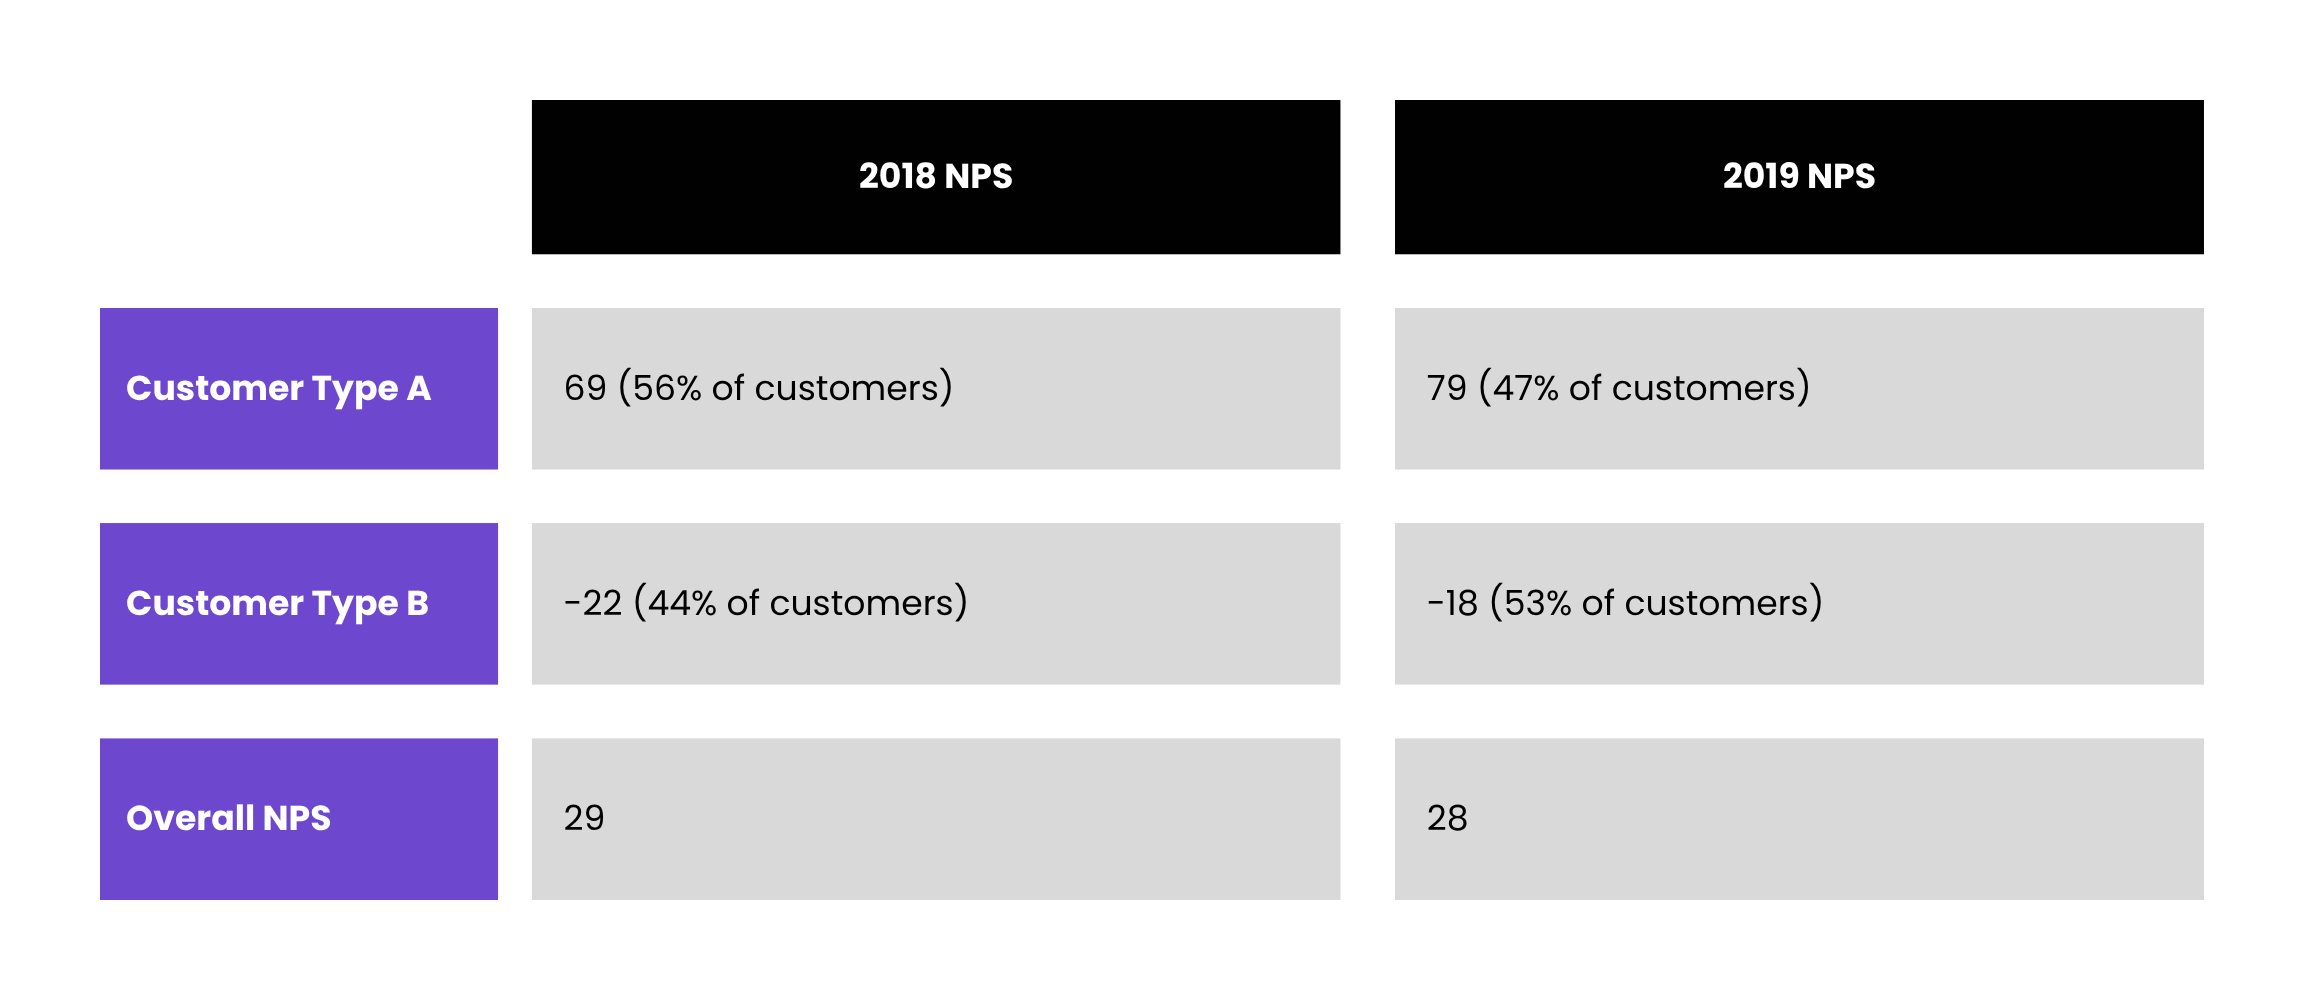
From this data, we’re likely to conclude that the company’s NPS slightly declined from 2018 to 2019 (29 → 28). However, when segmented, both customer types show improvement. So, what’s happening to drive this difference? Digging deeper, we find that what changed was the segmentation proportion—there are more Type B customers (who give lower scores) than there were in the 2019 mix.
Here’s another example from a checkout satisfaction survey:
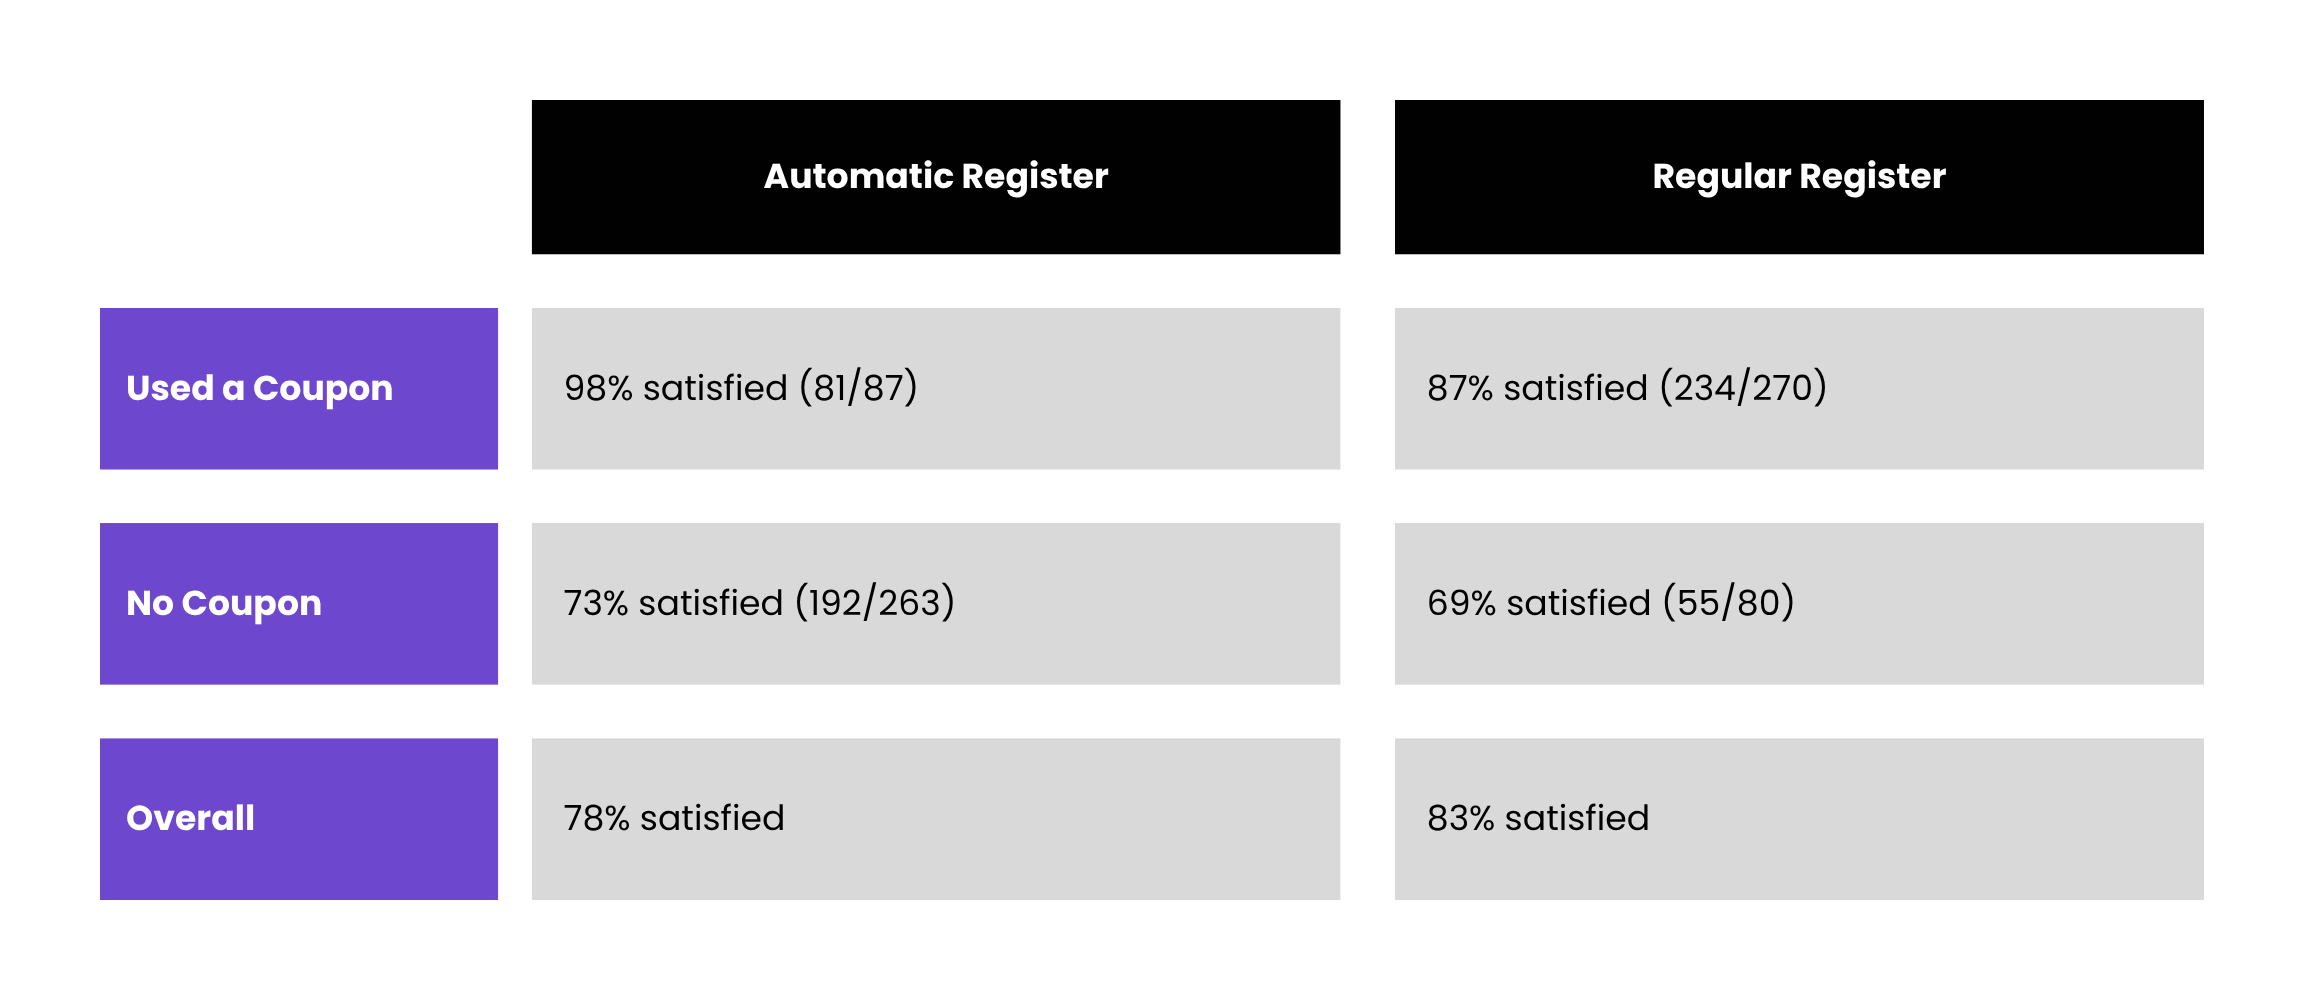
The overall, aggregated numbers suggest customers prefer regular registers (83% vs 78%). But looking at individual segments, automatic registers actually had higher satisfaction in both groups. This paradox occurs because coupon users (who report higher satisfaction) were more likely to use regular registers.

Understanding Confounding and Lurking Variables
A confounding variable is an external factor that is related to both the independent and dependent variables in your analysis. It can create a false impression of a relationship between the two, or mask a real one. In the checkout example, coupon usage is a confounding variable—influencing both satisfaction and register choice.
A lurking variable is a hidden factor that affects the relationship between the things being analyzed, but isn’t included in your analysis. It might not be directly connected to both variables, but it can still change the results and lead you to the wrong conclusions. In the above example, lurking variables might include things like type of transaction (coupons, returns, large orders), demographics, time of day, store traffic, employee interaction or prior experience with technology.
Other examples of common lurking variables in CX might include seasonal effects, competitor actions, staff scheduling patterns, or recent media coverage. You can’t control what you don’t measure, which is why segmentation often reveals these hidden influences.
How to Avoid Being Misled by Simpson’s Paradox
Conclusion: Look Beyond the Surface
Simpson’s Paradox is a powerful reminder: customer data can be deceptive if not carefully analyzed. Recognizing this statistical phenomenon and implementing the strategies above, allows you to avoid being misled by aggregate data and make more informed decisions that truly improve customer experience.
What hidden paradoxes are buried in your customer data, undermining your insights and decisions? Uncovering them could revolutionize your entire CX strategy.
Janna Lemster, Data Scientist
How Combining System Logs and Human Feedback Creates a Smarter Product Roadmap

Why trust determines research speed- and what teams can do about it.

AI provides scale and speed, while humans add emotion and depth to create a powerful tool.
to a detailed overview of our Market Research services, including our core pillars and capabilities!